- Understanding Sulfuric Acid Production: DCS Process Flow Diagram Design
In sulfuric acid production, process diagrams are indispensable. If we liken the DCS control system to the brain of sulfuric acid production, then process diagrams are as critical as the visual cortex of the brain. They determine operators' intuitive understanding of the production process and directly impact control efficiency.
A well-structured, professionally designed process diagram enables operators to grasp production status at a glance and swiftly pinpoint issues during abnormal conditions. This article explores the art and science of DCS process diagram design.
1. Design Concept
Here we present the primary process flow diagram for sulfuric acid production—the sulfur pyrolysis conversion section, as shown in Figure 1.

Figure 1 DCS Flowchart of the Sulfur Combustion Conversion Section
In DCS process flow design, we adhere to a philosophy of simplicity without simplification. Simplicity is achieved through a minimalist style that reduces visual load, making critical information and flow paths immediately apparent. Simultaneously, complexity is maintained through meticulous attention to detail and process integrity, ensuring strict adherence to unit characteristics in the design.
The overall gray-scale palette reduces visual fatigue for operators monitoring screens for extended periods. Crucially, this design ensures alarm feedback data remains highly intuitive and immediately recognizable.
2. Device and layout design
Component illustrations employ actual physical characteristics for rapid operator recognition. Component colors can be customized per client requirements, enhanced with 3D effects. The drying tower and secondary absorption tower serve as exemplars, as shown in Figure 2.

Figure 2 Comparison of Device Stereoscopic Design
Within the sulfur incineration and conversion section, we integrated liquid sulfur components to present the complete process flow from liquid sulfur to flue gas output. Related equipment is grouped in adjacent zones, divided into distinct sections with parameters and control points clearly arranged. This allows operators' visual focus to flow naturally without frequent screen switching to locate information.
The pipeline layout follows Figure 1, using arrows to indicate material flow direction. We minimize pipeline crossings to prevent visual clutter. Different material types are distinguished by colored pipelines: gray for flue gas, red for steam, green for water lines, purple for acid lines, etc. Appropriate color differentiation provides an intuitive visual representation of pipelines, avoiding the visual interference caused by uniform coloring.
3. Tag number and PID control display
Each tag number features a dedicated display box containing data inside and the tag name outside, establishing clear information hierarchy. Building on this design, PID control elements are visually emphasized by adding output and feedback values beside valves, displayed via connections to control point tags.

Figure 3 Tag Design
As shown in Figure 3, TR1213 represents the inlet temperature of the converter's second stage. The high-temperature superheater bypass valve controls this point's temperature via PID regulation.
Data is displayed with black as the base color, indicating normal status. During alarms, the monitoring screen switches to yellow and red with flashing indicators.
4. Dynamic design of valves and motors
For valves and motors, we use fill colors to indicate open/close and start/stop states. Color changes—green for open/close, red for start/stop—clearly convey operational status.

圖4 閥門、電機設計
Rotation commands are added for motors, enabling intuitive monitoring of operational status. Start/stop buttons are designed beside motor equipment, with button states clearly indicating current control status to enhance emergency response speed.
Conclusion
An excellent DCS process diagram serves not only as a control interface but also as a visual representation of process knowledge. In a high-safety-demand process like sulfuric acid production, aligning the process diagram with the field enhances operational efficiency and reduces operational risks. Only through continuous optimization, experience accumulation, and iterative refinement can we consistently empower the sulfuric acid industry.
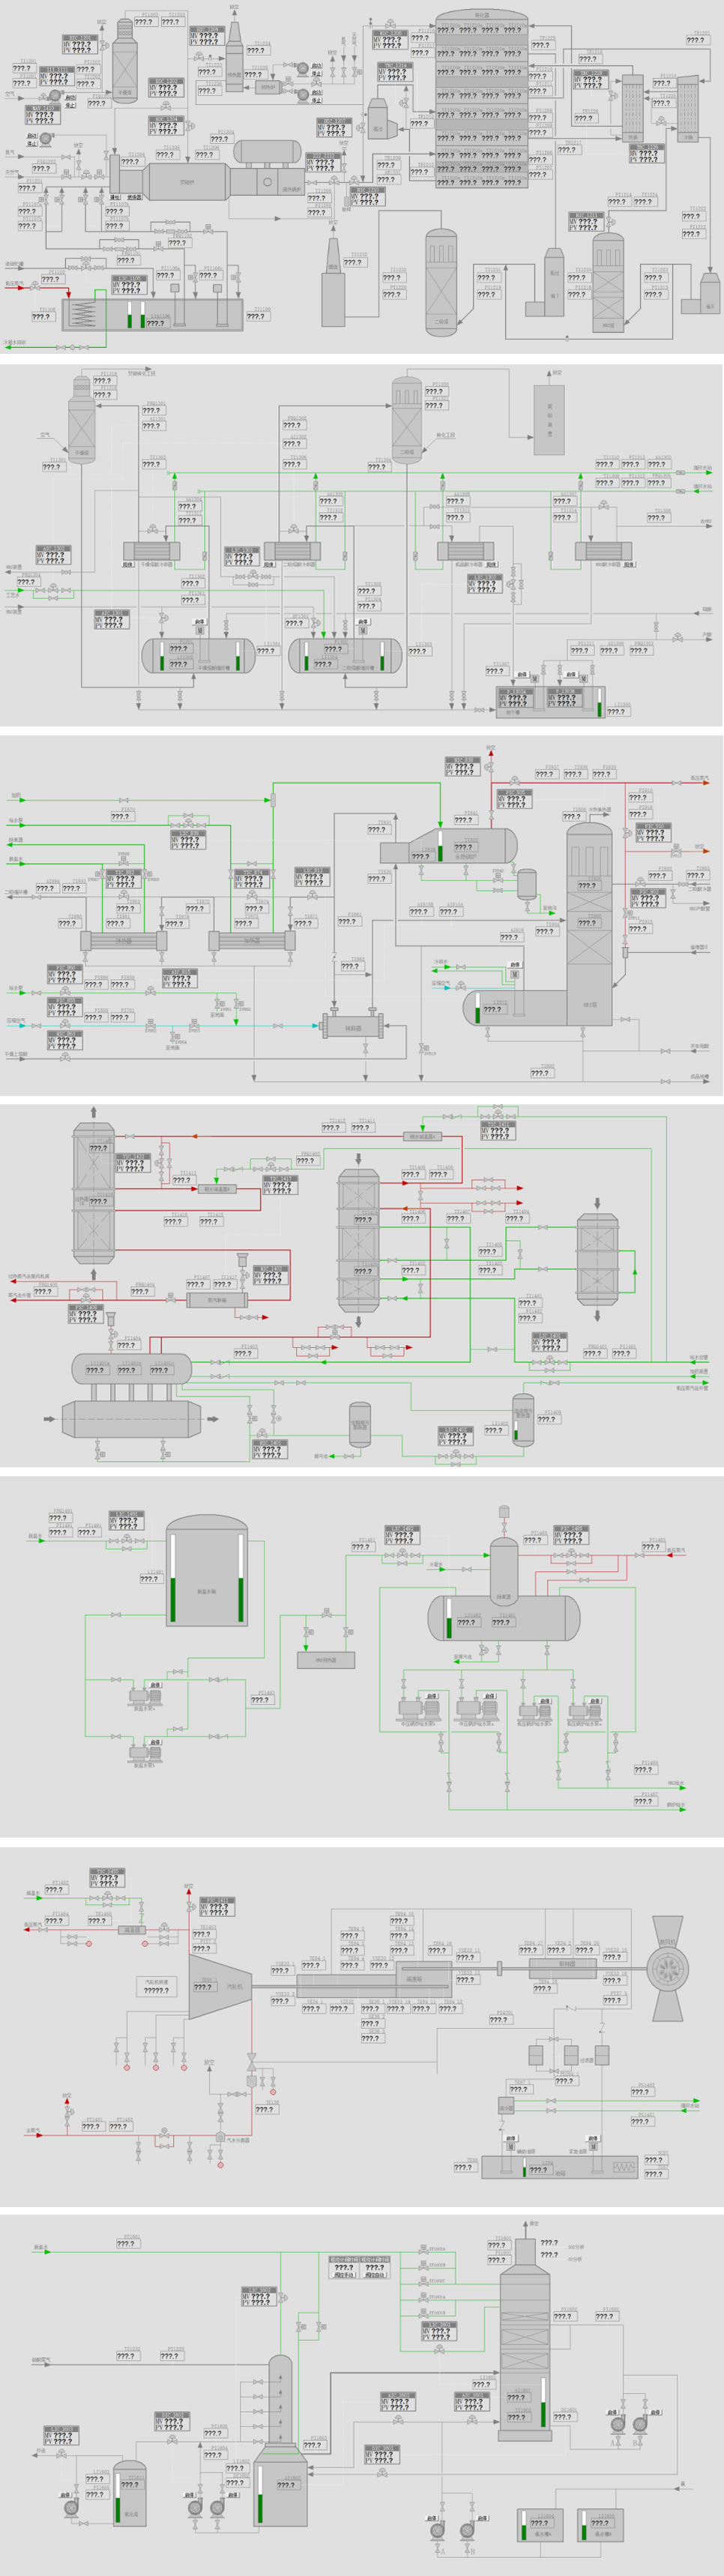
Complete Process Diagram Visualization: